
Weekly Market Update: 15 July 2026


A Risk-Off Week as the Middle East Escalates Again
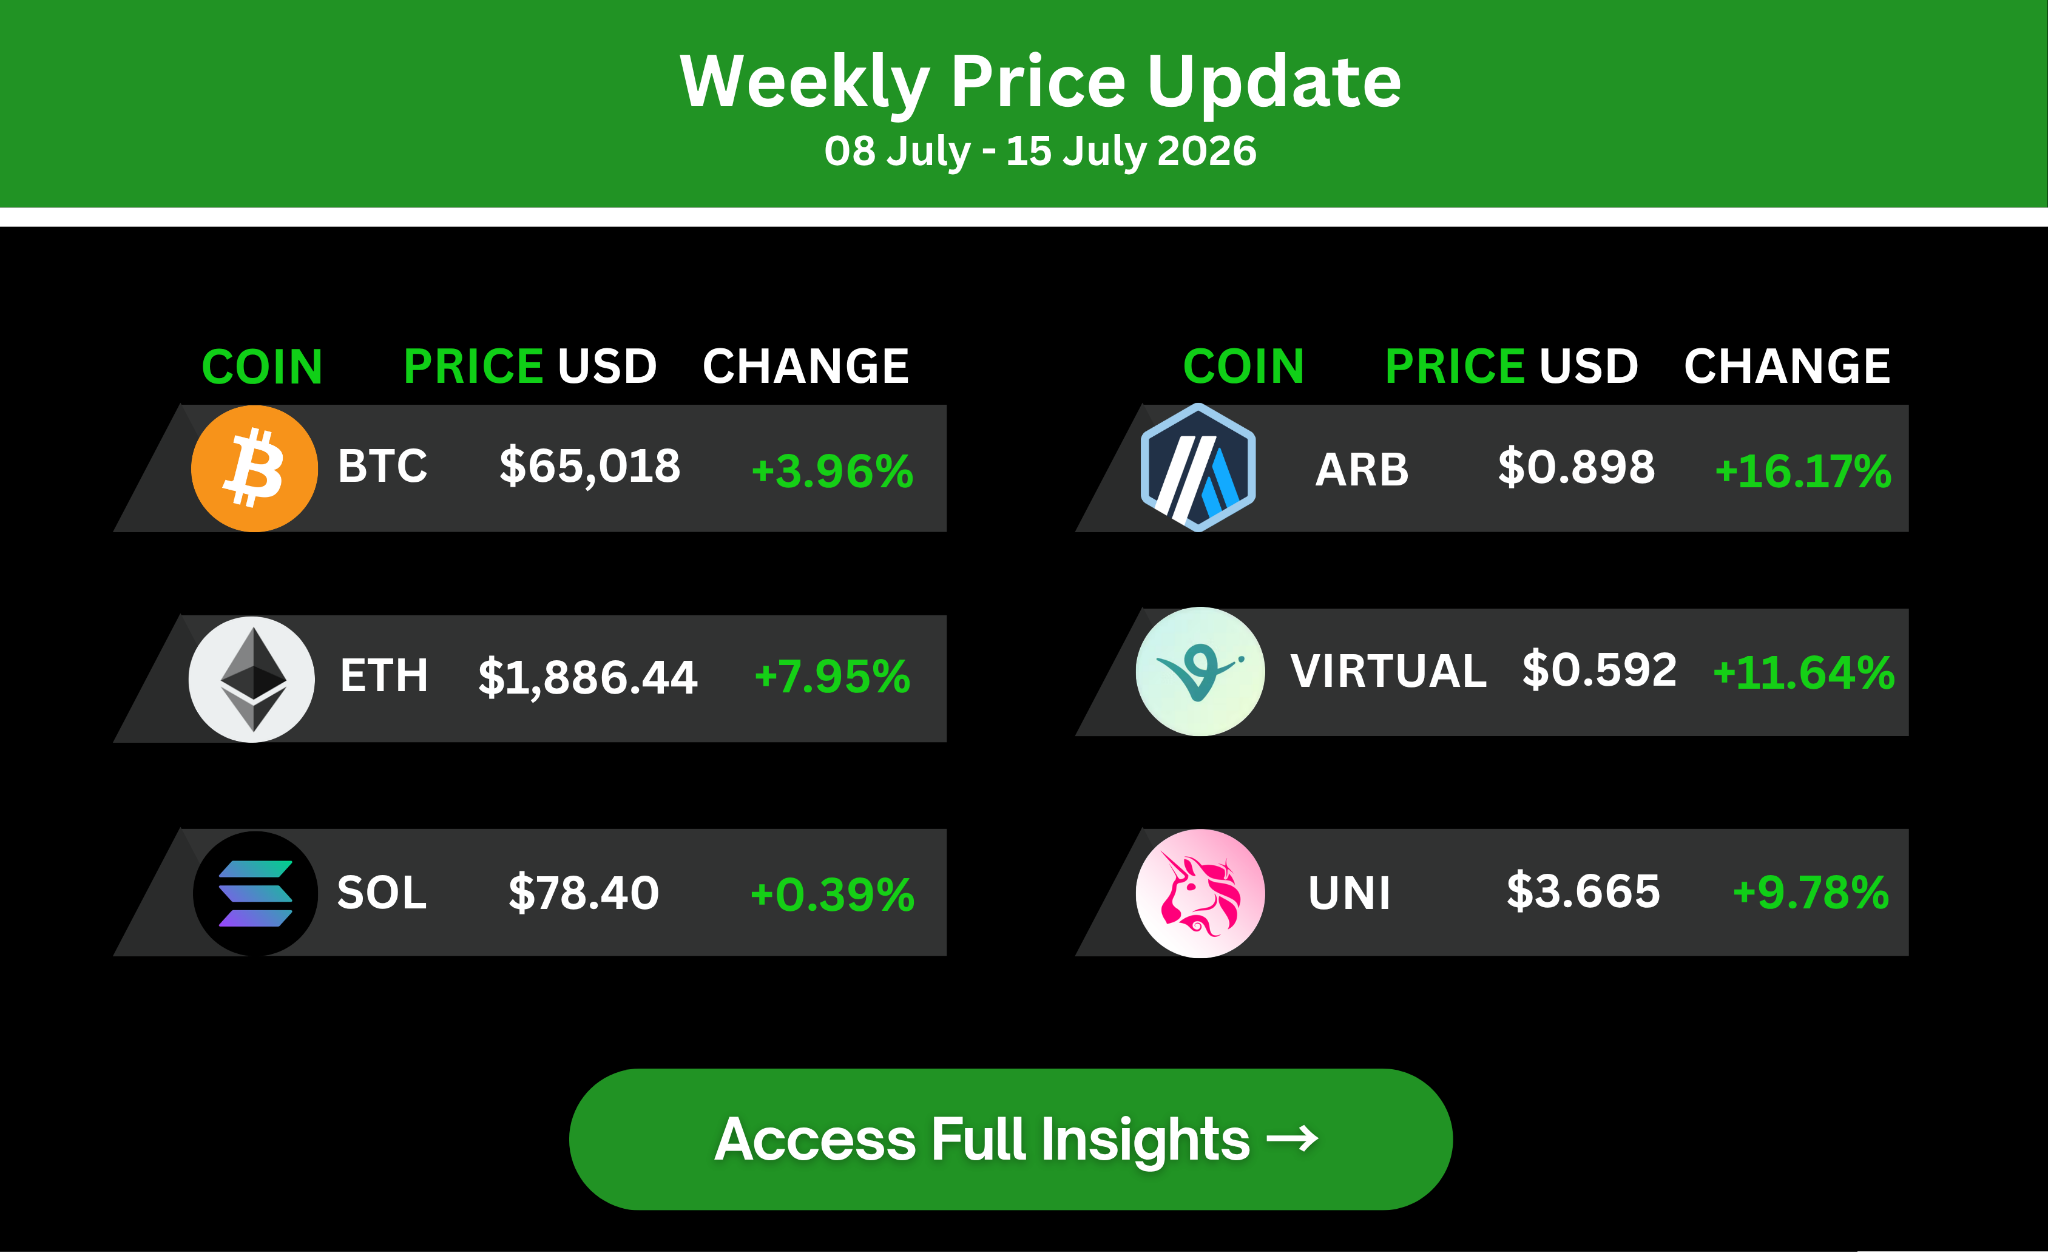
It has been a tense week across the board. Bitcoin slid to a low near $62,000 early in the week as the US and Iran traded strikes over the Strait of Hormuz, before a cooler-than-expected June CPI print on Tuesday sparked a sharp bounce, BTC pushing back toward $64,500 and Ethereum jumping over 6% intraday. Total crypto market cap sits around $2.23 trillion and sentiment has been camped in Extreme Fear territory for most of the week, a reminder of just how directly geopolitics is dictating price action right now rather than crypto-native catalysts.
The bigger story remains the four-year cycle debate that has been building for months. With Bitcoin now roughly 50% off its October all-time high, the timing lines up almost exactly with the historical playbook, and we dig into that below. Elsewhere, Jupiter just handed Collector Crypt its biggest legitimacy stamp yet, and Robinhood Chain's early numbers are genuinely hard to ignore.
US-Iran: The Strait of Hormuz Conflict Reignites
The ceasefire that briefly calmed markets in June has effectively collapsed. Over the past week the US and Iran have exchanged three consecutive nights of strikes, with CENTCOM hitting over 300 Iranian targets, coastal surveillance, missile and drone sites, naval capability, in response to Iranian attacks on commercial shipping in the Strait.
Trump's posture has shifted materially through the week too. He floated a 20% toll on all cargo passing through the Strait, walked it back in favour of trade and investment deals with Gulf states, then declared the US would unilaterally take control of the waterway and reimpose its naval blockade on Iranian ports regardless. He has also warned things get "really bad" next week, strikes on bridges and power infrastructure, if Tehran doesn't return to the table. Oman continues to mediate but a deal looks further away than it did a month ago.
BTC Crashes After Global Headlines
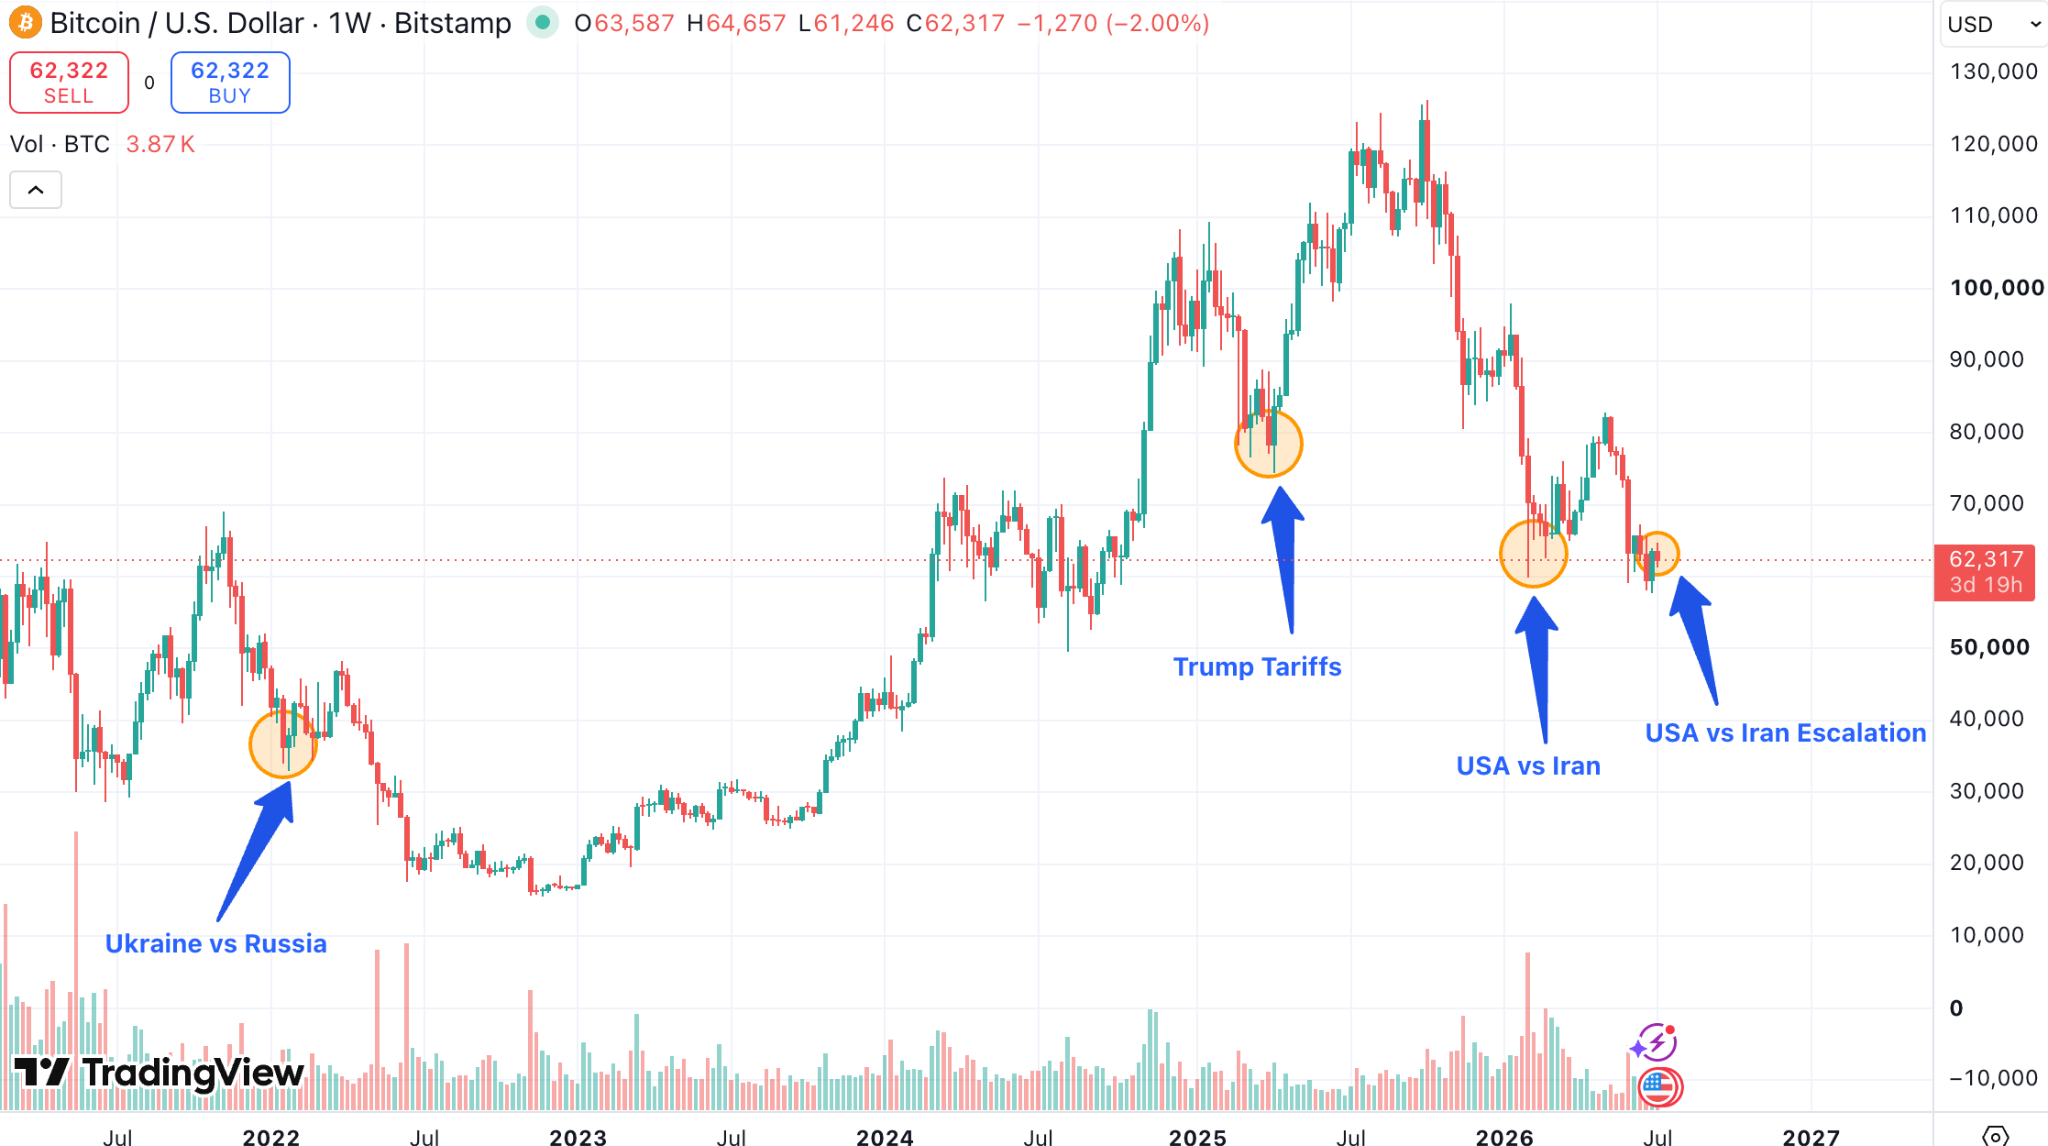
The market impact has been immediate and clear. Brent crude spiked over 9.5% in a single session to $83.30, its largest one-day move in six years, before easing back as strikes continued. Around 20% of global oil traffic runs through this waterway, so every escalation shows up almost instantly in energy prices, and from there into inflation expectations and risk appetite.
What is genuinely interesting is that Bitcoin barely reacted to any of it. Through three straight nights of strikes, tankers being hit, and a full Strait closure being declared, BTC has held a tight range and is actually up slightly on the week, a sharp contrast to June 2025 and February this year, when similar escalations sent it down 7%+ in days. Spot ETF flows also just snapped an eight-week outflow streak.
There are two ways to read that. The less exciting explanation is Bitcoin has structurally decoupled from geopolitical risk and is now trading almost entirely off dollar liquidity and Fed policy. The more interesting read, and the one we are watching, is that this muted reaction is a sign the easy selling has already happened, longs were liquidated roughly six times as often as shorts this week, pointing to a leverage flush rather than holders exiting. Absorbing a shock like this without making new lows starts to look like the quiet, low-volatility grind that shows up in an accumulation phase, which ties into where the four-year framework says we should be sitting.
The Four-Year Cycle — Still Relevant, or Broken?
With Bitcoin sitting around 50% below its October 6 all-time high, this is the moment to actually look at whether the four-year cycle framework still holds up.
The historical pattern is genuinely consistent. Across the three completed cycles, the average time from a cycle low to the next cycle top has been almost exactly 1,064 days, and the average time from that top to the next bottom has run closer to 364 days. The current cycle fits that shape almost too well to ignore, the last cycle low was in November 2022 around $15,460, and Bitcoin printed its all-time high on October 6, 2025 near $126,000, a stretch that lines up with the 1,064-day average within a matter of days.
If the second half of the pattern holds, a 364-day drawdown from that October top points towards early-mid October 2026 as the window for the next cycle low, which is roughly three months from where we sit today.

What makes this cycle different is the size of the move rather than the timing. Each cycle's peak multiple has shrunk significantly, 2012 ran roughly 92x off its low, 2016 around 30x, 2020 about 7.9x, and this cycle has done under 2x. That is not a sign the cycle is broken, it is closer to what you would expect from an asset maturing from a $200 million market into a multi-trillion dollar one, the same percentage move on a much larger base is simply not physically available anymore.
Where the real debate sits is causality. The original mechanism was a supply shock, the halving cuts new issuance of BTC, and historically that scarcity repriced the asset on a fairly predictable lag. With over 94% of total supply already mined, each halving now removes a smaller share of new issuance than the last, so the supply-side argument is structurally weaker than it was in 2012 or 2016.
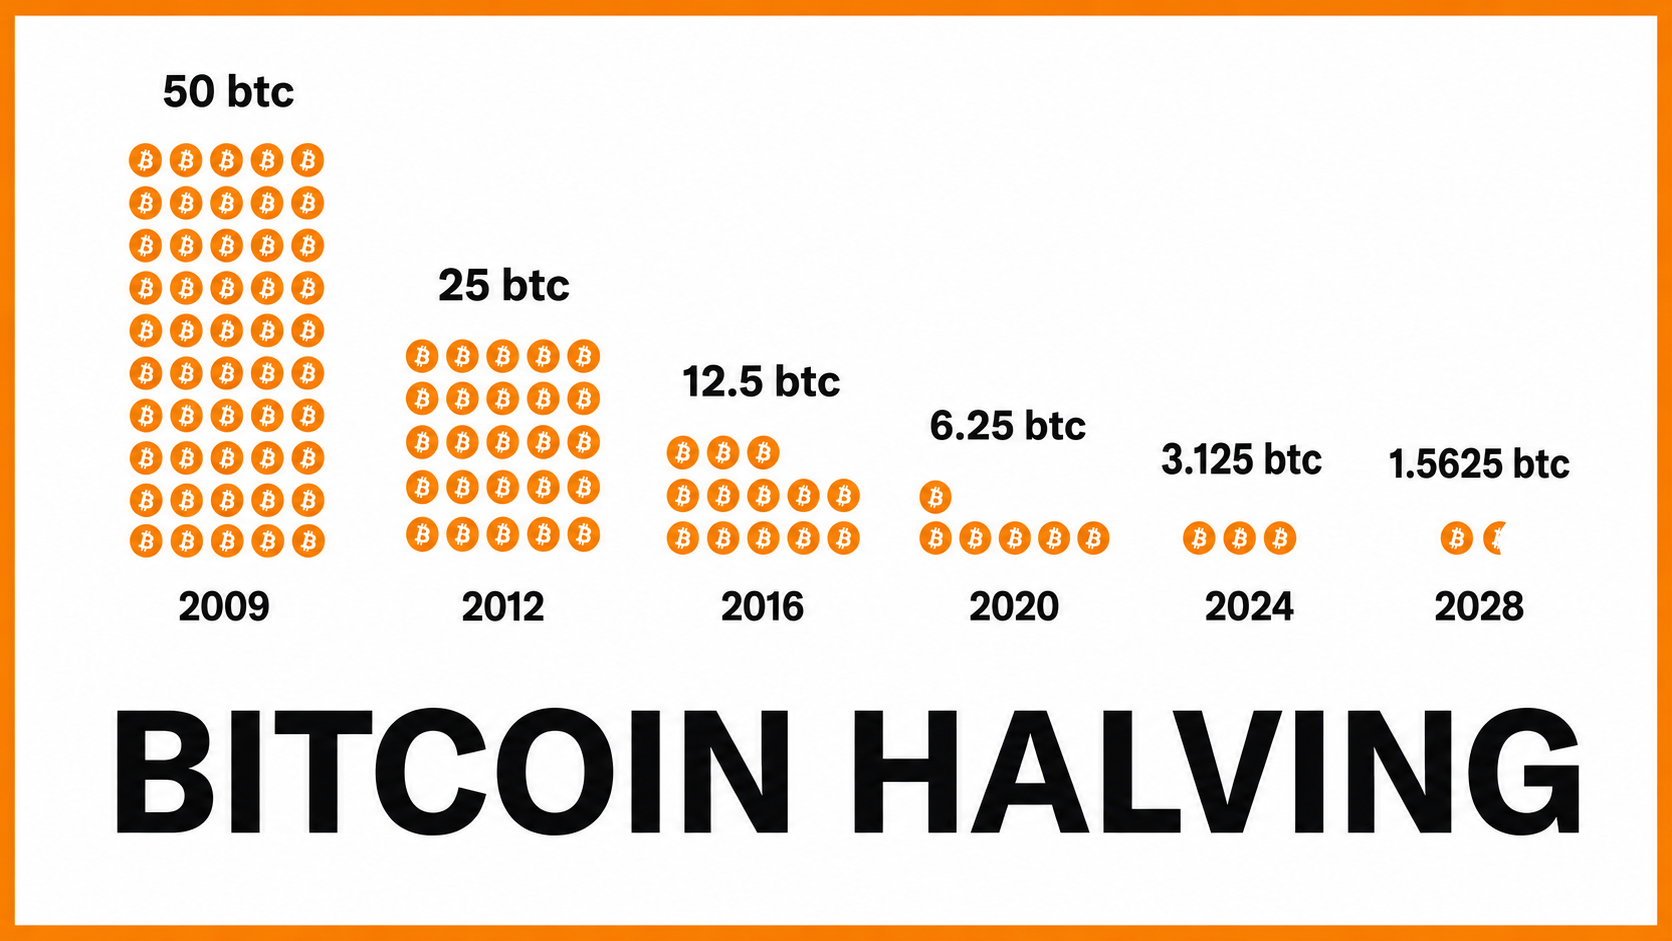
- From 50 BTC per block in 2009 to just 1.5625 BTC in 2028, the supply of newly issued Bitcoin continues to shrink.
What has replaced it, in our view, is a liquidity and macro cycle that happens to rhyme with the halving calendar rather than being driven by it, ETF flows, Fed policy, and now geopolitical shocks like the one above are doing far more to dictate price than block subsidy math. That is a meaningfully different mechanism producing a similar-looking chart, and it is why we would treat the 1,064/364 framework as a useful timing reference rather than a rule to trade blind. Worth watching either way given how close the historical window now sits.
CARDS Gets Its Biggest Distribution Win Yet — Jupiter Gacha
Jupiter, Solana's largest DEX aggregator, launched Jupiter Gacha in beta yesterday, a venue where users open digital packs and pull real, professionally graded Pokémon and One Piece cards backed one-to-one by physical slabs held in vaults. It was built directly with Collector Crypt, a token we have covered quite a bit in recent months.

This is exactly the kind of distribution catalyst we have been positioning around since our original CARDS coverage. Collector Crypt has processed over $1 billion in cumulative gacha volume on its own, and having a major Solana DEX with genuine institutional credibility, Jupiter was also selected by Securitize to help roll out regulated tokenised equities on Solana, put its name and liquidity behind the category is a real legitimacy signal rather than a partnership announcement that fades in a week. It mirrors the Robinhood Chain and Lighter dynamic we covered recently, a business with real revenue getting plugged into a platform with genuine reach and an existing user base.
CARDS is trading around $0.16 with a market cap near $40 million as of writing, up on the news but still a fraction of the valuation the underlying revenue numbers would imply if the market fully repriced it the way it has other RevFi names. Early days for the beta, and gacha mechanics always carry a speculative, collectible-driven element on top of the fundamentals, but the direction of travel here has been consistent for months now.
DeFiLlama: Robinhood Chain's Numbers Two Weeks In
Following on from Robinhood Chain's mainnet launch, the ecosystems performance two weeks in are worth a proper look. TVL has gone from zero at launch on July 1 to over $165million, crossing $100 million within the first week and adding another 258% in the last 7 days alone.
Roughly $97 million of that TVL sits in a single protocol, Morpho, powering the Robinhood Earn lending product, with Uniswap's dedicated AMM a distant second at $60 million. A meaningful chunk of the latest jump came from Ethena seeding around $50 million into a Steakhouse Financial USDG vault on Morpho.
Robinhood Chain TVL and DEX Volume

Cumulative DEX volume has now crossed $4 billion, and on a couple of days this week Robinhood Chain's daily DEX volume actually outpaced Hyperliquid's, Base's, and Ethereum's. That activity has pushed it into the top five chains by 7-day DEX volume, now moving close to 10% of all onchain DEX volume.

While the capital base is still small compared to competitors, Robinhood Chain is punching well above its weight in DEX activity, posting the highest DEX volume-to-TVL ratio of any competing chain. That's a real capital efficiency signal, the money sitting on the chain is turning over into trades far more often than it's just sitting parked. It points to a lot of people actively moving capital in and out of positions chasing momentum and opportunity rather than parking it in a single asset, which is a different usage pattern to a lot of newer chains where TVL sits idle waiting for incentives.
Weekly Alpha Space
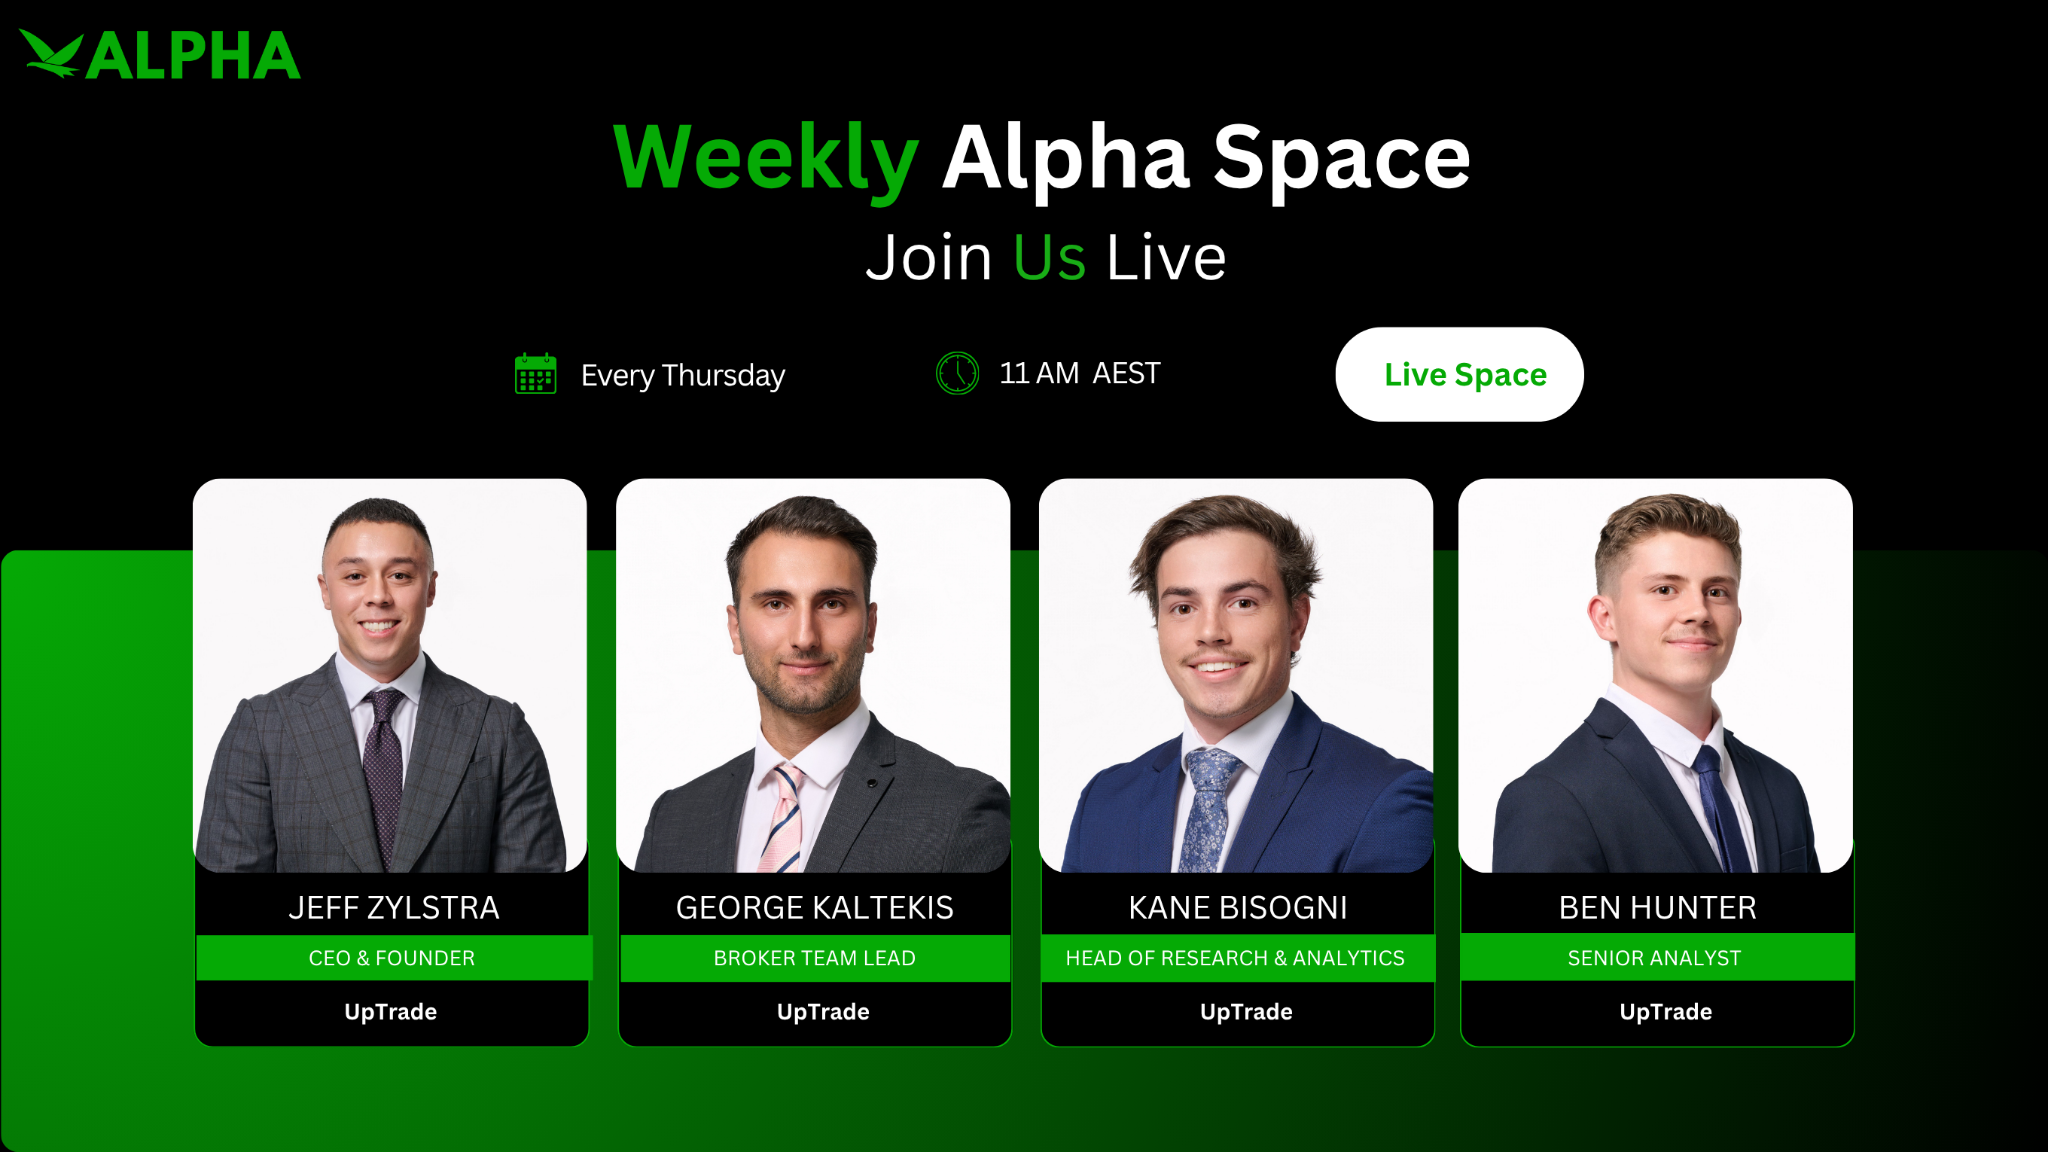
Join the research and broker team live every Thursday at 11AM AEST for our Weekly Alpha Space, where we break down everything moving in the market in real time, the biggest stories, the charts we are watching, and the opportunities we are positioning around. It is the best way to get our unfiltered take and ask your questions directly. Head to uptradealpha.com to join us.
General information only. This article is for educational purposes and does not constitute financial, investment, legal or tax advice, nor a recommendation to buy, sell or hold any asset. Cryptocurrency is a high-risk asset and you should consider your own circumstances and seek independent advice before making any decision. Uptrade does not make price predictions.
Kane leads our international research division, delivering clear, actionable insights into crypto markets and emerging investment opportunities. A true “crypto native,” he has over seven years of hands-on experience, formal qualifications in finance and economics, and has worked across Web3 hedge funds, venture capital, and leading incubators.
View all articles